
A few weeks ago, we polled the Awful Announcing readers on their opinions of each local broadcast team around the majors. The polls were broken down division by division to gain the perspective of both fans and rivals for each broadcast team.
The votes are in, and we weighted your grades on a four point scale for each broadcast crew and sorted them to determine who your favorite and least favorite broadcast teams were. Each “A” vote received 4 points, 3 points for a “B” vote, down to 0 points for an “F” vote. The total points scored were divided by the total number of votes to calculate what amounts to a GPA for each broadcast booth.
If you’re interested in the full vote tallies, you can click here.
Here are the rankings from two years ago when we first embarked upon this exercise.

32. Chicago White Sox (away): 1.26
Previous ranking: 30
Previous grade: 1.37
-Hawk Harrelson (play by play)
-Steve Stone (analyst)
Most popular grade: F (45.48% of votes)
Analysis: I have no idea how their grade actually got *worse* than two years ago, but so be it. No team had more F votes or a higher percentage of F votes than the White Sox home crew – which I’m sure you expected. The Sox were also the one team to not even crack 100 B votes or the 10% mark of B votes.

31. Washington Nationals: 1.48
Previous ranking: 27
Previous grade: 1.79
-Bob Carpenter (play by play)
-FP Santangelo (analyst)
-Johnny Holliday (play by play – select)
-Ray Knight (analyst – select)
Most popular grade: F (38.28% of votes)
Analysis: The Nationals’ crew took another step backwards, dropping below two crews they were ranked ahead of two years ago. Only the White Sox had a higher total of F votes and a higher percentage of F votes than this MASN crew.

30. St Louis Cardinals: 1.50
Previous ranking: 28
Previous grade: 1.67
-Dan McLaughlin (play by play)
-Al Hrabosky (analyst)
-Rick Horton (play by play – select)
-Tim McCarver (analyst – select)
Most popular grade: F (35.66% of votes)
Analysis: The Cardinals were one of two teams to leapfrog the Nationals in this year’s rankings, along with the team in 29th. They were the third and final crew, along with the two we’ve already seen, that broke the 30% mark in F votes and collect at least 200 F votes.

29. Colorado Rockies: 1.66
Previous ranking: 29
Previous grade: 1.63
-Drew Goodman (play by play)
-Jeff Huson (analyst)
-Ryan Spilborghs (analyst – select)
Most popular grade: C (44.85% of votes)
Analysis: So this is strange – the Rockies crew had a nearly identical rating two years ago, but leapfrogged two teams (Nationals, Cardinals) due to the declines of those teams. The Rockies also received, by far, the fewest A votes of any team, and were one of just two teams to not crack 10% A votes. They couldn’t even break 5%! Also, no team had a higher percentage of C votes than the Rockies – nearly 45%.
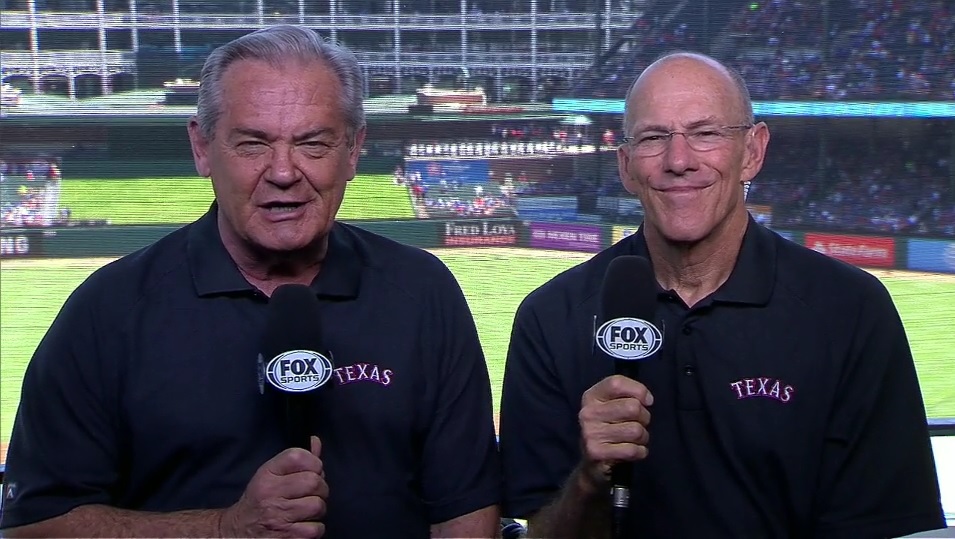
28. Texas Rangers: 1.90
Previous ranking: 22
Previous grade: 2.02
-Steve Busby (play by play)
-Tom Grieve (analyst)
-Dave Raymond (play by play – select)
Most popular grade: C (29.33% of votes)
Analysis: First off – that screencap is fantastic. Secondly, the Rangers crew fell six spots in the rankings, which makes sense given their overall grade change.
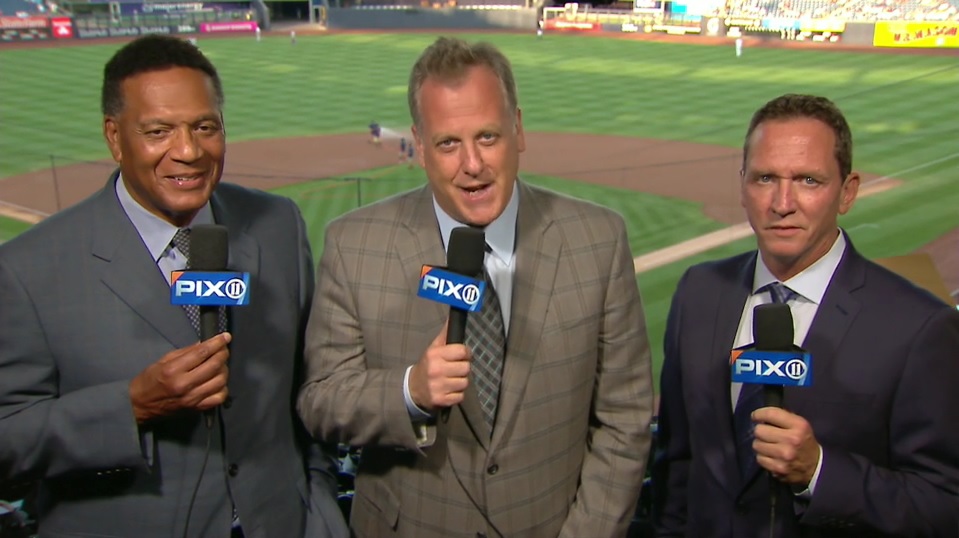
27. New York Yankees: 1.95
Previous ranking: 25
Previous grade: 1.93
-Michael Kay (play by play)
-Ken Singleton (analyst)
-David Cone (analyst)
-John Flaherty (analyst)
-Al Leiter (analyst)
-Paul O’Neill (analyst)
-Bob Lorenz (play by play – select)
-Ryan Ruocco (play by play – select)
Most popular grade: F (22.90% of votes)
Analysis: The Yankees tumble a couple of spots, but their grade remains nearly unchanged. Their overall percentages were all over the map, with all five grades landing somewhere between 17% and 23%.
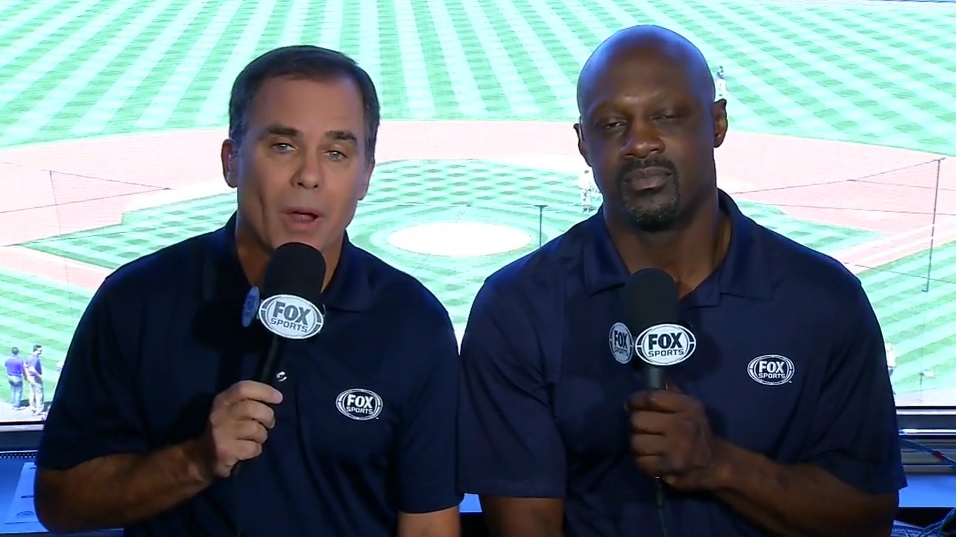
26. Miami Marlins: 1.98
Previous ranking: 24
Previous grade: 1.95
-Rich Waltz (play by play)
-Eduardo Perez (analyst)
-Preston Wilson (analyst)
-Al Leiter (analyst)
Most popular grade: C (33.08% of votes)
Analysis: The Marlins are in a similar situation as the Yankees – their grade remained relatively unchanged, but the inclusion of two extra teams in the rankings this year bumped them down a couple of spots.
25. Cincinnati Reds: 2.09
Previous ranking: 15
Previous grade: 2.20
-Thom Brennaman (play by play)
-Chris Welsh (analyst)
-George Grande (play by play – select)
-Jim Kelch (play by play – select)
Most popular grade: B (25.72% of votes)
Analysis: The Reds crew took a big hit this year, tumbling ten spots as their grade also declined. Cincinnati’s team had the highest percentage of A votes for any team outside of the top 20, but also had the highest percentage of F grades of any team in the top 25.

Paul Oneil and Michel Kaye are HORRIBLE ONLY slightly better are John Sterling and Susyn Waldman