
Last week, we polled the Awful Announcing readers on their opinions of each local broadcast team around the majors. The polls were broken down division by division to gain the perspective of both fans and rivals for each broadcast team.
The votes are in, and we weighted your grades on a four point scale for each broadcast crew and sorted them to determine who your favorite and least favorite broadcast teams were. Each “A” vote received 4 points, 3 points for a “B” vote, down to 0 points for an “F” vote. The total points scored were divided by the total number of votes to calculate what amounts to a GPA for each broadcast booth.
If you’re interested in the full vote tallies, you can click here.
Here are the rankings from 2014 and 2016 when we previously polled out readers.

31. Chicago White Sox (road): 1.26
-Hawk Harrelson (play by play)
-Steve Stone (analyst)
-Tom Paciorek (analyst – select)
Previous rankings: 30 (2014), 32 (2016)
Previous grades: 1.37 (2014), 1.26 (2016)
Most popular grade: F (48.61% of the vote)
Analysis: Our readers have made it three polls in a row at the bottom for Hawk Harrelson and company, to the shock of absolutely no one. The White Sox road crew’s score was the same as it was last year, and they also picked up the most F votes out of any team (as you’d expect).

30. Washington Nationals: 1.37
-Bob Carpenter (play by play)
-FP Santangelo (analyst)
Previous rankings: 27 (2014), 31 (2016)
Previous grades: 1.79 (2014), 1.48 (2016)
Most popular grade: F (41.14% of the vote)
Analysis: While the White Sox retained the bottom spot once again, the Nationals crew returned as the second-worst crew in baseball for the second straight season. Bob and FP picked up the second-most F votes (behind the White Sox), and were the only other team to have 40% of their votes as the low score. Given their drop in score compared to last season, and some possible nostalgia votes for the White Sox in 2018, could this be the team that brings up the rear next season?

29. St. Louis Cardinals – 1.48
-Dan McLaughlin (play by play)
-Al Hrabosky (analyst)
-Ricky Horton (analyst – select)
-Rick Ankiel (analyst – select)
-Tim McCarver (analyst – select)
-Jim Edmonds (analyst – select)
Previous rankings: 28 (2014), 30 (2016)
Previous grades: 1.67 (2014), 1.50 (2016)
Most popular grade: F (37.16% of the vote)
Analysis: Cardinals fans still aren’t homers about their broadcast team, and that’s reflected in the subpar score for their crew. The Cardinals finished third from the bottom for the third poll, and it’s tough to see them improving much without some massive changes. St. Louis was the third of three teams to receive at least 30% F votes.

28. Texas Rangers – 1.64
-Dave Raymond (play by play)
-Tom Grieve (analyst)
-CJ Nitkowski (analyst)
Previous rankings: 22 (2014), 28 (2016)
Previous grades: 2.02 (2014), 1.90 (2016)
Most popular grade: F (26.67% of the vote)
Analysis: A new analyst in CJ Nitkowski didn’t change much for the Rangers, who saw their total score decline once again. However, while the team did draw more F votes than any other result, they nearly drew as many C votes, and their total of B and D votes were equal. They did receive the second-fewest A votes of any team, though.

27. Miami Marlins – 1.75
-Rich Waltz (play by play)
-Todd Hollandsworth (analyst)
Previous rankings: 24 (2014), 26 (2016)
Previous grades: 1.95 (2014), 1.98 (2016)
Most popular grade: C (35.63% of the vote)
Analysis: The Fox Sports Florida crew just can’t get any love. This is the third different partner Rich Waltz has had in our rankings, and the results just don’t end up changing all that much. Mediocrity reigns in Miami, as the Marlins received the most C votes and second-highest percentage of C votes of any team.

26. Boston Red Sox – 1.86
-Dave O’Brien (play by play)
-Jerry Remy (analyst)
-Tom Caron (play by play – select)
-Dennis Eckersley (analyst – select)
-Steve Lyons (analyst – select)
Previous rankings: 13 (2014), 16 (2016)
Previous grades: 2.44 (2014), 2.34 (2016)
Most popular grade: F (27.68% of the vote)
Analysis: If this result comes as a surprise to you, you won’t be surprised to know that the Red Sox received the fourth-most votes of any team behind the Phillies, Mets, and Yankees, who flooded our polls in record numbers and likely didn’t miss a chance to slide their rivals down the rankings. That being said, it’s not as if the Red Sox crew pulled in great ratings anyway – they received the second-fewest A ratings and second-most C ratings out of any team in the AL East.
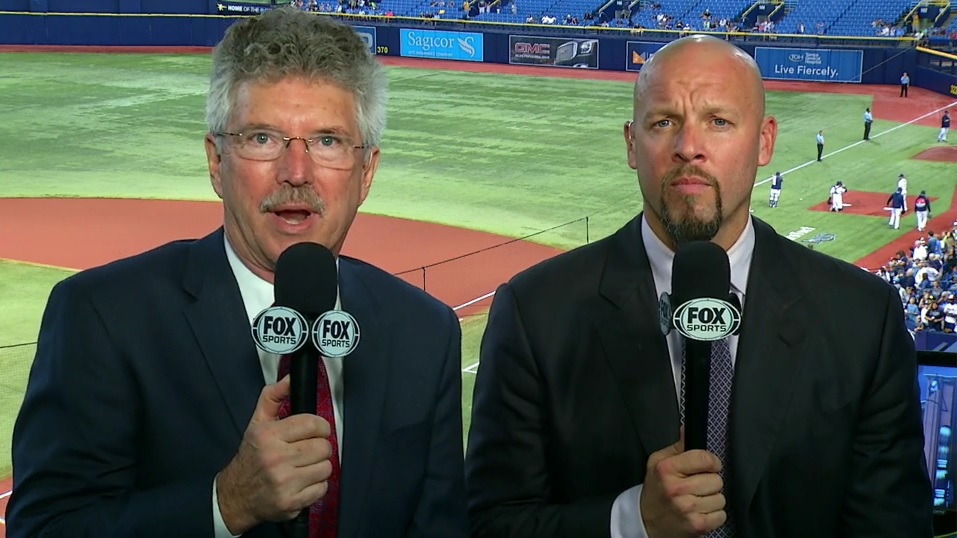
25. Tampa Bay Rays – 1.88
-Dewayne Staats (play by play)
-Brian Anderson (analyst)
-Orestes Destrade (analyst – select)
Previous rankings: 16 (2014), 24 (2016)
Previous grades: 2.20 (2014), 2.10 (2016)
Most popular grade: C (29.52% of the vote)
Analysis: Speaking of the AL East, the Rays’ overall rating was similar to that last year, though their score fell. All five of the grades for the Rays landed between 12% and 30% of the vote, meaning that they don’t really stand out in any way – good or bad.

24. Colorado Rockies – 1.91
-Drew Goodman (play by play)
-Jeff Huson (analyst)
-Ryan Spilborghs (analyst – select)
Previous rankings: 29 (2014), 29 (2014)
Previous grades: 1.63 (2014), 1.66 (2016)
Most popular grade: C (43.16% of the vote)
Analysis: The Rockies (comparatively) soared in our ratings, though their 570 total votes was the lowest among any team in our polls. As such, the Rockies received the fewest number of A grades (44) and the lowest percentage of A grades (just 7.72%), but the lack of F votes (just 13.33%, lower than any team we’ve seen so far in the rankings) helped pull them up in the rankings.
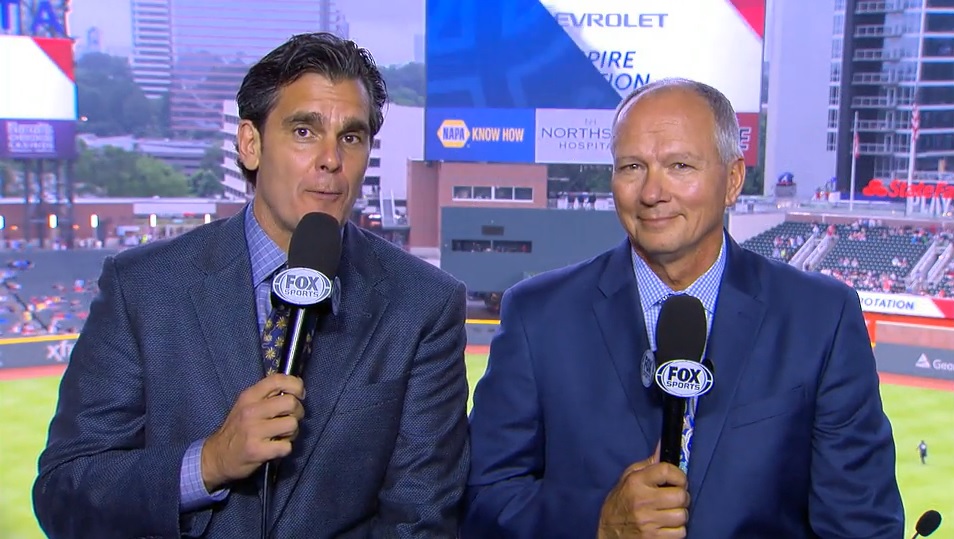
23. Atlanta Braves – 1.91
-Chip Caray (play by play)
-Joe Simpson (analyst)
-Dale Murphy (analyst – select)
-Tim Hudson (analyst – select)
-Tom Glavine (analyst – select)
Previous rankings: 21 (2014), 13 (2016)
Previous grades: 2.06 (2014), 2.41 (2016)
Most popular grade: C (27.71% of the vote)
Analysis: After a year that saw them move into the top half of the rankings, the Braves fell into the bottom third. An A was the grade given least often to this club (156 times, or only 12.53%), and their 345 C votes were tied for the second-most of any team.

22. Pittsburgh Pirates – 2.08
-Joe Block (play by play)
-Greg Brown (play by play)
-Bob Walk (analyst)
-Steve Blass (analyst – home)
-John Wehner (analyst – road)
Previous rankings: 14 (2014), 14 (2016)
Previous grades: 2.28 (2014), 2.40 (2016)
Most popular grade: C (33.09% of the vote)
Analysis: The Pirates are at the bottom of the third tier of our rankings, where a handful of teams generally reside every year. A few votes can flip things in one direction or another, and they just weren’t on the Pirates’ side this year. With just 10.41% of users giving them an A and 13.09% giving them an F, most of their ratings were clustered in the middle.
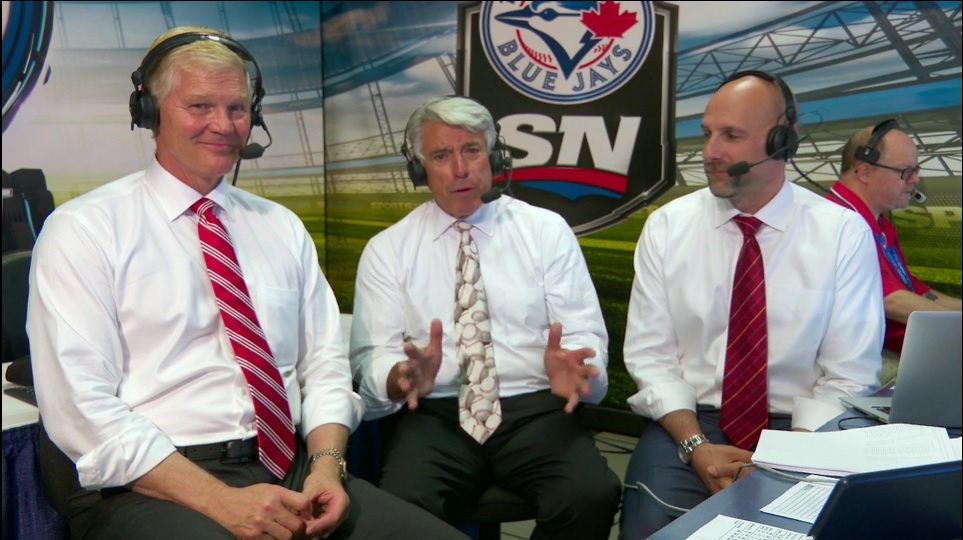
21. Toronto Blue Jays – 2.08
-Buck Martinez (play by play)
-Pat Tabler (analyst)
-Matt Devlin (play by play – select)
-Dan Shulman (play by play – select)
-Joe Siddall (analyst – select)
Previous rankings: 20 (2014), 8 (2016)
Previous grades: 2.06 (2014), 2.58 (2016)
Most popular grade: B (29.17% of the vote)
Analysis: At first, I wondered what caused the Blue Jays’ rating to slip so much from last year (aside from the surge of Yankees fans voting). Then I looked at their 2014 rating, and realized that maybe the high 2016 rating was actually the outlier. Toronto 29.17% B votes is the highest of any team in the lower half of our rankings, but their ability to climb higher was held back by their 20.35% F votes, the second-highest among any team in the top three-quarters of the rankings.
