If you would like to ask about or request ratings for a program or event on these networks, please reach Douglas on Twitter @SonOfTheBronx.
Ratings News and Notes
-
It was the first night of the 2017-18 traditional TV season on Monday, Sep. 25 and the winning network on the night was still ESPN, with the Week 3 “Monday Night Football” game – a Dallas Cowboys’ 28-17 victory over the Arizona Cardinals. ESPN won Monday night among all networks (broadcast or cable) in households, viewers and all key male and adult demos (18-34, 18-49 and 25-54) for the third consecutive week.
In Dallas, the game delivered a 9.2 rating on ESPN and a 19.8 rating on WFAA-ABC, for a combined 29.0 rating in the market. In Phoenix, the game delivered a 13.6 rating on ESPN and an 8.6 on KUTP-IND, for a combined 22.2 rating in the market.
The top 10 metered markets (not including those of the competing teams): San Antonio (20.9), Austin (20.3), Norfolk (15.1), Richmond-Petersburg (14.0), Albuquerque-Santa Fe (13.7), Memphis (13.4), Washington D.C. (13.3), New Orleans (12.9), Philadelphia (12.6) and Buffalo (11.2). (Source: ESPN)
-
The ESPN daily newsmagazine “Outside the Lines (First Report)” averaged 380,000 viewers per day for the week of Sep. 25-29. This marks the program’s most-watched week in total viewers since Jan. 16-20 (394,000 viewers). Discussions about the NFL players’ response to Donald Trump’s remarks helped boost the Monday, Sep. 25 (361,000 viewers) and Tuesday, Sep. 26 (378,000 viewers) editions. The week’s top telecast came on Wednesday, Sep. 27 (484,000 viewers) when news broke that Rick Pitino had been placed on unpaid administrative leave from the University of Louisville amid a “pay for play” scandal.
ESPN Top 25 (and Select) Programs
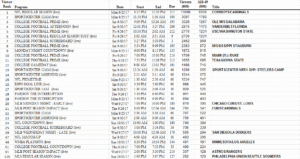
Click on image grid for larger view
In total viewership for its entire week in Prime Time (8 p.m. to 11 p.m.), ESPN is up 24 percent (3,142,000 vs. 2,542,000) from one week earlier and up 40 percent (3,142,000 vs. 2,249,000) from the same week one year ago (September 26-October 2, 2016).
In total viewership for its entire week in Total Day (6 a.m. to 5:59 a.m.), ESPN is up 17 percent (1,057,000 vs. 906,,000) from one week earlier and up 23 percent (1,057,000 vs. 869,000) from the same week one year ago (September 26-October 2, 2016).
ESPN’s daily programs viewership averages for the week:
- “First Take” (ESPN, Sep. 25-29 10 a.m.): 476,000 (261,000 adults 18-49)
- “Outside the Lines: First Report” (ESPN, Sep. 25-29): 380,000 (199,000 adults 18-49)
- “NFL Live” (ESPN, Sep. 25-26 & 28-29): 385,000 (216,000 adults 18-49)
- “NBA: The Jump” (ESPN, Sep. 26 & 28-29): 355,000 (206,000 adults 18-49)
- “SportsNation” (ESPN, Sep. 26 & 28-29): 376,000 (241,000 adults 18-49)
- “Highly Questionable” (ESPN, Sep. 25-26 & 28-29): 465,000 (271,000 adults 18-49)
- “Around the Horn” (ESPN, Sep. 25-26 & 28-29): 499,000 (251,000 adults 18-49)
- “Pardon the Interruption” (ESPN, Sep. 25-29): 738,000 (347,000 adults 18-49)
- “Daily Fantasy Show” (ESPN, Sep. 25): 251,000 (124,000 adults 18-49)
- “SportsCenter” (ESPN, Sep. 25-29 7 a.m.): 311,000 (178,000 adults 18-49)
- “SportsCenter” (ESPN, Sep. 25-29 8 a.m.): 296,000 (176,000 adults 18-49)
- “SportsCenter” (ESPN, Sep. 25-29 9 a.m.): 332,000 (189,000 adults 18-49)
- “SportsCenter” (ESPN, Sep. 26-29 6 p.m.): 508,000 (277,000 adults 18-49)
- “SportsCenter” (ESPN, Sep. 28 11 p.m.): 652,000 (365,000 adults 18-49)
- “SportsCenter” (ESPN, Sep. 25-26, 28, 30 & Oct. 1 midnight): 1,409,000 (799,000 adults 18-49)
- “SportsCenter at Night” (ESPN, Sep. 25-28, 30 & Oct. 1 1 a.m.): 480,000 (281,000 adults 18-49)
ESPN2 Top 25 (and Select) Programs
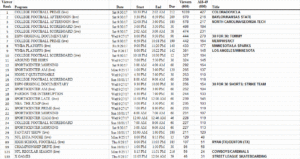
Click on image grid for larger view
In total viewership for its entire week in Prime Time (8 p.m. to 11 p.m.), ESPN2 is down 43 percent (250,000 vs. 437,000) from one week earlier and down 35 percent (250,000 vs. 384,000) from the same week one year ago (September 26-October 2, 2016).
In total viewership for its entire week in Total Day (6 a.m. to 5:59 a.m.), ESPN2 is down 3 percent (197,000 vs. 204,000) from one week earlier and down 26 percent (197,000 vs. 266,000) from the same week one year ago (September 26-October 2, 2016).
ESPN2’s daily show viewership averages for the week:
- “Mike & Mike in the Morning” (ESPN2, Sep. 25-29): 189,000 (89,000 adults 18-49)
- “College Football Live” (ESPN2, Sep. 25-29): 120,000 (57,000 adults 18-49)
- “MLB Network’s Intentional Talk” (ESPN2, Sep. 25-26 & 28-29): 74,000 (40,000 adults 18-49)
- “The Paul Finebaum Show” (ESPN2, Sep. 26 & 28-29): 115,000 (65,000 adults 18-49)
- “Daily Fantasy Football” (ESPN2, Sep. 25-26 & 28-29 5 p.m.): 74,000 (43,000 adults 18-49)
- “Baseball Tonight” (ESPN2, Sep. 27 & Oct. 1): 89,000 (33,000 adults 18-49)
- “Jalen & Jacoby” (ESPN2, Sep. 25-29 late night): 80,000 (45,000 adults 18-49)
- “Best of Mike & Mike” (ESPN2, Late Sep. 28/Early Sep. 29 5 a.m.): 132,000 (72,000 adults 18-49)
- “ESPN FC” (ESPN2, Oct. 1): 52,000 (22,000 adults 18-49)
- “Nacion ESPN” (ESPN2, Sep. 28): 50,000 (36,000 adults 18-49)
- “NFL Live” (ESPN2, Sep. 27): 193,000 (83,000 adults 18-49)
- “NBA: The Jump” (ESPN2, Sep. 25 & 27): 208,000 (96,000 adults 18-49)
- “SportsNation” (ESPN2, Sep. 25): 183,000 (106,000 adults 18-49)
- “Highly Questionable” (ESPN2, Sep. 27): 263,000 (110,000 adults 18-49)
- “Around the Horn” (ESPN2, Sep. 27): 324,000 (145,000 adults 18-49)
- “SportsCenter” (ESPN2, Sep. 25-29 10 a.m.): 142,000 (74,000 adults 18-49)
- “SportsCenter” (ESPN2, Sep. 25-29 11 a.m.): 126,000 (67,000 adults 18-49)
- “SportsCenter” (ESPN2, Sep. 25 6 p.m.): 161,000 (86,000 adults 18-49)
- “SportsCenter” (ESPN2, Sep. 25, 27 & 29 7 p.m.): 177,000 (89,000 adults 18-49)
- “SportsCenter” (ESPN2, Sep. 26 10:22 p.m.): 195,000 (92,000 adults 18-49)
- “SportsCenter” (ESPN2, Sep. 27 midnight): 228,000 (119,000 adults 18-49)
- “SportsCenter” (ESPN2, Sep. 29 1 a.m.): 112,000 (64,000 adults 18-49)
ESPNU Top 25 (and Select) Programs
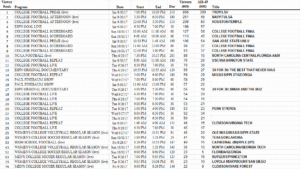
Click on image grid for larger view
In total viewership for its entire week in Prime Time (8 p.m. to 11 p.m.), ESPNU is up 18 percent (154,000 vs. 130,000) from one week earlier and up 93?percent (154,000 vs. 80,000) from the same week one year ago (September 26-October 2, 2016).
In total viewership for its entire week in Total Day (6 a.m. to 5:59 a.m.), ESPNU is down 10 percent (63,000 vs. 70,000) from one week earlier and down 17 percent (63,000 vs. 76,000) from the same week one year ago (September 26-October 2, 2016).
ESPNU’s daily show viewership averages for the week:
- “The Dan Le Batard Show” (ESPNU, Sep. 25-29): 25,000 (20,000 adults 18-49)
- “The Paul Finebaum Show” (ESPNU, Sep. 27): 38,000 (11,000 adults 18-49)
Source: Live+Same Day data, Nielsen Media Research

