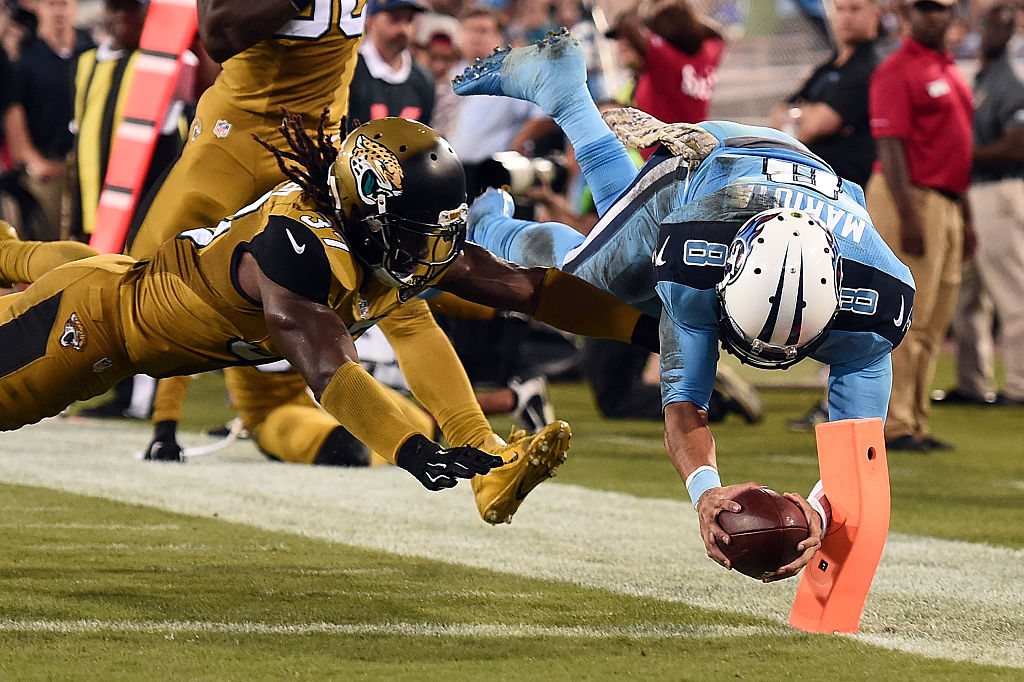
The NFL is frequently seen as a league with significant parity thanks to a hard salary cap and a restrictive draft, but that’s not true when it comes to each team’s drawing power for national television. As with other leagues such as the NHL, there are massive gaps between the teams that draw the most and the teams that draw the least, and that’s thoroughly illustrated in this Advertising Age piece by Anthony Crupi about how teams rank in terms of the audiences they drew for national windows in 2016.
Crupi’s focus is how the playoffs set up to be very favorable for NFL broadcasters, with the top six teams (Dallas, Detroit, Pittsburgh, New England, Green Bay and the New York Giants) all involved. However, what’s perhaps just as interesting is who’s at the bottom and what those teams have in common. Here’s a look at the bottom 10 teams in his analysis, starting with the lowest:
| Tennessee Titans | 5.07 million viewers | 3.2 household rating |
| Jacksonville Jaguars | 5.07 million viewers | 3.2 household rating |
| Cleveland Browns | 5.67 million viewers | 3.5 household rating |
| Miami Dolphins | 6.15 million viewers | 3.7 household rating |
| New York Jets | 9.07 million viewers | 5.6 household rating |
| Baltimore Ravens | 11.1 million viewers | 5.9 household rating |
| New Orleans Saints | 10.7 million viewers | 6.5 household rating |
| Cincinnati Bengals | 11.5 million viewers | 6.7 household rating |
| Houston Texans | 12.1 million viewers | 7.1 household rating |
| Atlanta Falcons | 12.2 million viewers | 7.2 household rating |
What similarities are there between those teams? Well, it’s not all market size. Yes, there are some smaller-market teams on there, but New York is the biggest TV market out there (according to Nielsen’s rankings), and Houston and Atlanta are 8th and 10th respectively, while Miami is 16th. It’s also not all about record: yes, the Jaguars were 3-13, the Browns were 1-15, the Jets were 5-11, the Saints were 7-9 and the Bengals were 6-9-1, but the Dolphins, Texans and Falcons are all playoff teams, the Titans were 9-7 and the Ravens were 8-8. One of the more interesting points of commonality between the teams is conference; the bottom six teams, and eight out of the bottom 10 overall (with the Saints and the Falcons as the exceptions), all play in the AFC.
Of course, it’s not shocking that the NFC has more high-drawing teams than the AFC. Some of that’s thanks to history; the AFC is largely teams from the old AFL, which spun up as a rival to the NFL and put teams in markets that didn’t already have NFL teams (or, in the case of the Jets, added a second team to a market). Moreover, NFC teams have consistently drawn well for years, with Dallas in particular often shining. Four of the top six and seven of the top 10 teams on this list play in the NFC, so it shouldn’t be too surprising that there are AFC teams near the bottom.
There are other caveats to consider, too. The lowest-rated national TV window was the eight NFL Network-only Thursday Night Football broadcasts, and most of these teams were involved in those. That’s probably a big reason why Miami in particular is here; the Dolphins were involved in two different NFL Network-only games.
Beyond that, the highest-rated national TV window was Fox’s nine “America’s Game of the Week” broadcasts (eight Sunday afternoon games and a Thanksgiving one), posting 26 million viewers and a 14.7 household rating, and Fox carries the NFC package (apart from the cross-flex). However, CBS’ afternoon window was second with 23 million viewers and a 12.8 household rating, and most of their games were from the AFC. It should be noted that CBS’ biggest audience was for two NFC teams on Thanksgiving, though, with Vikings-Lions drawing 27.6 million.
This also doesn’t mean that all AFC teams are poor draws, or that all NFC teams are great. The Falcons being so bad here is surprising given their market size and 11-5 record, but part of that’s thanks to their involvement in a NFLN-only game. It should also be kept in mind that the Steelers and Patriots finished third and fourth overall respectively in these rankings. However, when you look at the overall picture, there are a lot of NFC teams near the top and a lot of AFC teams near the bottom.
That helps explain why Fox’s NFC package is worth more than CBS’ AFC package. The difference was $4.27 billion versus $3.73 billion under the old TV contracts, and it seems safe to assume that the 2011 renewal of contracts kept those relative proportions at least somewhat intact. While there are some strong draws from the AFC and some weak draws from the NFC, games from the latter conference appear to be a much better bet for ratings in general.


Comments are closed.