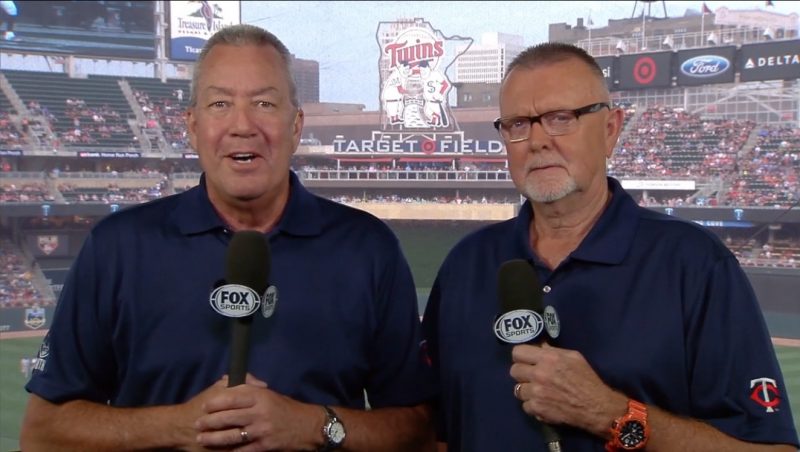
10. Minnesota Twins: 2.4976
-Dick Bremer (play by play)
-Bert Blyleven (analyst)
-LaTroy Hawkins (analyst)
-Jim Kaat (analyst)
-Justin Morneau (analyst)
-Jack Morris (analyst)
-Roy Smalley (analyst)
Previous rankings: 7 (2014), 19 (2016), 13 (2017), 15 (2018)
Previous grades: 2.63 (2014), 2.31 (2016), 2.40 (2017), 2.39 (2018)
Most popular grade: B (32.63% of votes)
Analysis: The Twins slid into the top ten for the second time ever thanks to one (one!) A grade. They’ve cut back Bert Blyleven’s workload a bit this year, and I think fans are responding more to younger broadcasters like Justin Morneau.
9. Oakland Athletics: 2.55
-Glen Kuiper (play by play)
-Dallas Braden (analyst)
-Ray Fosse (analyst)
Previous rankings: 6 (2014), 7 (2016), 11 (2017), 11 (2018)
Previous grades: 2.70 (2014), 2.58 (2016), 2.50 (2017), 2.54 (2018)
Most popular grade: B (34.73% of votes)
Analysis: More remarkable consistency from the A’s – their score was virtually identical to last year, and their ranking hopped up a couple spots. Oakland is also the first of four teams to receive under 10% F grades, and only two teams received a lower share of D and F grades. Incredibly, of the five California teams in MLB, the A’s are the lowest ranked of the five, and they’re in the top ten.

8. Milwaukee Brewers: 2.59
-Brian Anderson (play by play)
-Matt Lepay (play by play)
-Bill Schroeder (analyst)
Previous rankings: 8 (2014), 11 (2016), 9 (2017), 8 (2018)
Previous grades: 2.59 (2014), 2.57 (2016), 2.63 (2017), 2.63 (2018)
Most popular grade: A (32.29% of votes)
Analysis: The consistency of Milwaukee’s booth astounds me. Their lowest grade is a 2.57, their highest is a 2.63, their lowest ranking is 11th, and their highest is eighth. When Brian Anderson was busy with his Turner work in the early part of the season, Matt Lepay did a fine job in the booth, and if Anderson ever does depart, the Brewers should be in good hands.

7. Toronto Blue Jays: 2.64
-Buck Martinez (play by play/analyst)
-Dan Shulman (play by play)
-Pat Tabler (analyst)
Previous rankings: 20 (2014), 8 (2016), 21 (2017), 5 (2018)
Previous grades: 2.06 (2014), 2.58 (2016), 2.08 (2017), 2.75 (2018)
Most popular grade: A (31.59% of votes)
Analysis: Another strong ranking for the Blue Jays, two years after Dan Shulman left Sunday Night Baseball and picked up more work in Toronto. This once again proves me theory: Canadians love Dan Shulman. This (and one team we haven’t seen yet) ranking really tells me that you don’t need to have a winning (or even competitive) team to create an enjoyable broadcast.
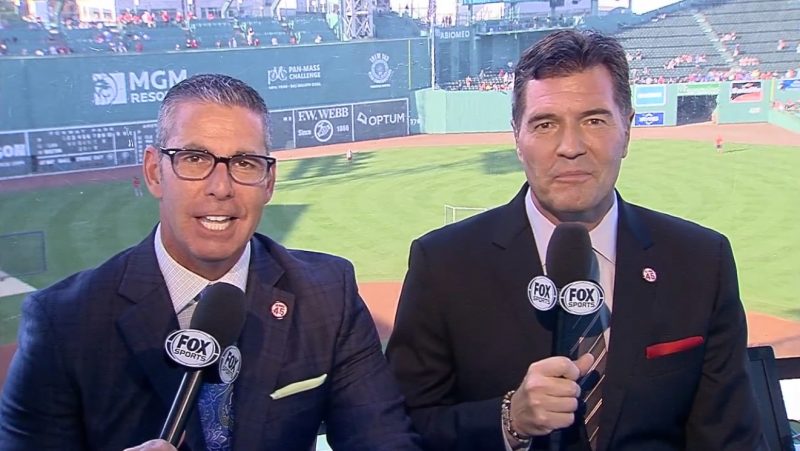
6. Los Angeles Angels: 2.72
-Victor Rojas (play by play)
-Mark Gubicza (analyst)
Previous rankings: 9 (2014), 9 (2016), 8 (2017), 6 (2018)
Previous grades: 2.53 (2014), 2.57 (2016), 2.65 (2017), 2.71 (2018)
Most popular grade: A (39.04% of votes)
Analysis: I believe the Angels are the only team to increase their grade every year we’ve done this. They don’t seem to take themselves too seriously, yet still provide interesting and insightful analysis and commentary. It’s purely anecdotal, but I think more people are attempting to tune into Angels games because of how awesome Mike Trout is, and are gaining more of an appreciation for this broadcast crew.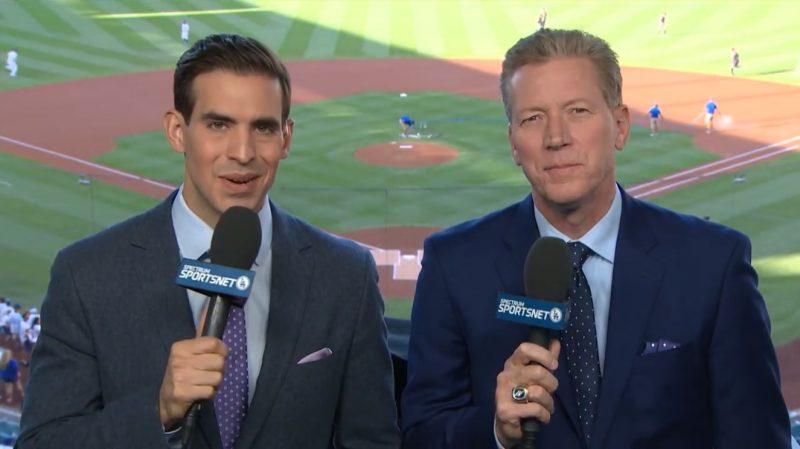
5. Los Angeles Dodgers: 2.83
-Joe Davis (play by play)
-Orel Hershiser (analyst)
-Nomar Garciaparra (analyst)
Previous rankings: 21 (2016), 7 (2017), 13 (2018)
Previous grades: 2.22 (2016), 2.65 (2017), 2.44 (2018)
Most popular grade: A (47.95% of votes)
Analysis: The Dodgers received the most votes of any broadcast crew in this year’s polls, and the ballot box stuffing resulted in them receiving the highest total of A votes of any team and the highest total of F votes of any team in the top half of the rankings. Fun fact: I don’t have a take on the Dodgers crew because I live in Southern California and don’t have Spectrum, so I’m still blacked out five years after the launch of SportsNet LA.
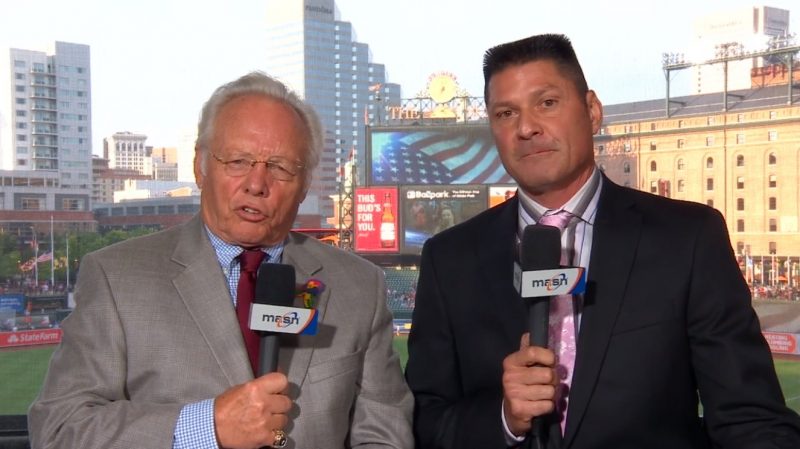
4. Baltimore Orioles: 2.90
-Gary Thorne (play by play)
-Jim Hunter (play by play)
-Jim Palmer (analyst)
-Ben McDonald (analyst)
-Mike Bordick (analyst)
-Brian Roberts (analyst)
Previous rankings: 3 (2014), 3 (2016), 6 (2017), 4 (2018)
Previous grades: 3.14 (2014), 3.15 (2016), 2.83 (2017), 2.94 (2018)
Most popular grade: A (38.66% of votes)
Analysis: The Orioles have started to add more analysts to their broadcasts and have relied on Jim Palmer less, and the result has been…well, fine, especially given how unwatchable the on-field product has been at times. Over 70% of the Orioles grades were either an A or B, and they are the third of four teams with under 10% of both D and F votes.
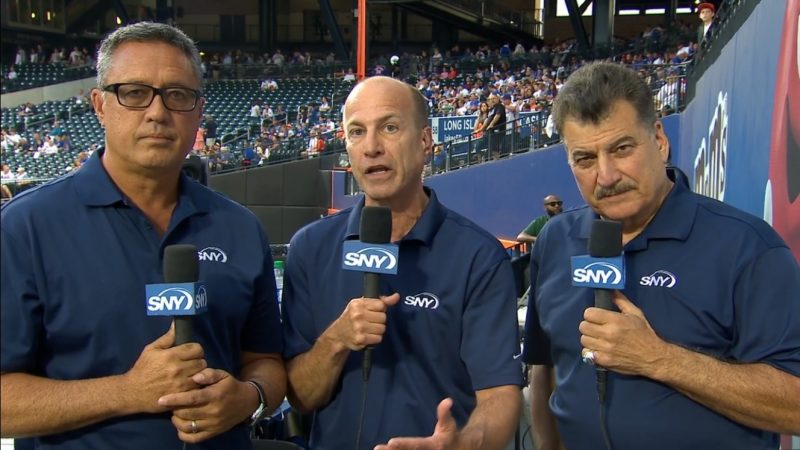
3. New York Mets: 2.97
-Gary Cohen (play by play)
-Ron Darling (analyst)
-Keith Hernandez (analyst)
Previous rankings: 4 (2014), 4 (2016), 3 (2017), 3 (2018)
Previous grades: 2.99 (2014), 3.06 (2016), 2.92 (2017), 3.12 (2018)
Most popular grade: A (54.91% of votes)
Analysis: The Mets just can’t crack the top two. They’ve finished in third for the third-straight year, despite finishing with the highest overall percentage of A votes of any team this year. However, that was balanced out by the third-lowest percentage of B votes and the second-lowest percentage of C votes. That strong share of A votes wasn’t enough to edge out the #2 team, who received a similar share of A votes, but a much higher cut of B votes.
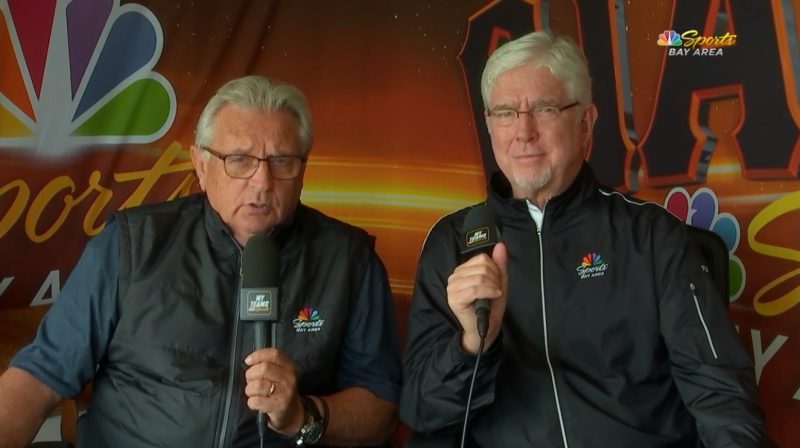
2. San Francisco Giants: 2.98
-Duane Kuiper (play by play)
-Dave Flemming (play by play)
-Jon Miller (play by play)
-Mike Krukow (analyst)
-Jeremy Affeldt (analyst)
-Javier Lopez (analyst)
Previous rankings: 1 (2014), 2 (2016), 1 (2017), 1 (2018)
Previous grades: 3.46 (2014), 3.54 (2016), 3.15 (2017), 3.15 (2018)
Most popular grade: A (54.66% of votes)
Analysis: There will be no three-peat for the Giants. The reigning champs have been dethroned by the slimmest of margins, thanks in large part to a whopping 14.10% of F votes, the highest of any team in the top ten. It does say something about this Giants crew when their lowest ever grade and ranking are 2.98 and #2, though.

1. San Diego Padres: 2.99
-Don Orsillo (play by play)
-Mark Grant (analyst)
-Mark Sweeney (analyst)
Previous rankings: 12 (2014), 5 (2016), 4 (2017), 3 (2018)
Previous grades: 2.46 (2014), 2.87 (2016), 2.87 (2017), 3.06 (2018)
Most popular grade: A (49.67% of votes)
Analysis: Long live the king! The San Diego Padres have creeped up the rankings every year we’ve done them, and despite their overall grade slipping this year, they did just enough to get over the line and finish in first. The Padres had the lowest share of F votes of any team (7.48%) and the second lowest share of D votes (4.16%). Over 88% of their votes were an A, B, or C. Yes, two teams had higher shares of A grades, and they were in the bottom 10 of percentage of B grades, but it’s that combination of very few bad grades and a whole lot of excellent grades that helps propel to you the top. Hey, this ranking tastes a lot better than nearly 30-year old gum, right?

