If you would like to ask about or request ratings for a program or event on these networks, please reach Douglas on Twitter @SonOfTheBronx.
Ratings News and Notes
YES Network billed the New York Yankees’ games with the New York Mets and the Boston Red Sox for Aug. 11-20 as “Rivalry Week” and it provided big ratings for the Yankees’ regional sports network. The Wednesday, Aug. 16 game at the Mets on YES delivered a 4.61 local rating in the New York TV market – the highest-rated regular season Subway Series game on a NY RSN in six years. YES was also the highest-rated network in the New York market on Aug. 16 for 7 consecutive quarter hours, from 9:00 to 10:45 pm, opposite broadcast entries like ABC’s “CMA Music Fest” and the debut of NBC sitcom “Marlon.”
As for the games’ New York TV market household ratings in the Yankees-Mets series:
- Mets @ Yankees, Mon. Aug. 14: YES 3.96, SNY 3.16
- Mets @ Yankees, Tue. Aug. 15: WPIX 4.70, SNY 2.88
- Yankees @ Mets, Wed. Aug. 16: YES 4.61, SNY 2.86
- Yankees @ Mets, Thu. Aug. 17: YES 4.05, WPIX 2.55
To put these figures into perspective, Yankees games on YES Network averaged a 3.67 rating in July, the channel’s best July since 2012; and, thru July 9, Mets games on SNY have averaged a 2.86 rating this season.
The Friday, Aug. 18 Yankees-Red Sox game on YES averaged 571,000 total viewers, a 5.78 TV Household rating and 424,000 TV Households. It was the highest-rated, most-viewed and most-watched regional sports network game telecast in the New York market since YES’ September 25, 2014 Orioles-Yankees game telecast, Derek Jeter’s last game at Yankee Stadium (10.84 TV Household rating). Excluding that September 25, 2014 game, Aug. 18 was the highest-rated and most-viewed New York RSN program since YES’ Red Sox-Yankees game on October 3, 2012.
The telecast peaked during the 9:45-10:00 pm ET quarter-hour, when it did a 7.09 TV Household rating (702,000 Total Viewers; 521,000 Households). Gary Sanchez hit his solo homer at 9:43 ET that night when he led off the top of the seventh inning (tying the game at 3-3), an inning which ultimately saw the Yankees score a total of four runs.
Not surprisingly, Yankees-Red Sox was the #1 television program on the night of Aug. 18 in the New York market in: TV household rating, total viewers, TV households; Males 18+; Males 18-49; Males 25-54; and other demos. Since the All-Star break, primetime Yankees games on YES have ranked #1 in New York in 26 of 30 game nights thru Aug. 18 in various key demos.
(Sources: YES, SNY, WPIX, Newsday)
- TBS Network’s non-exclusive telecast of New York Yankees at Boston Red Sox on Aug. 20 — the network’s second showcase this season between these same two teams at Fenway Park — drew 609,000 viewers and 219,000 adults 18-49. These were the top marks for an MLB regular season game on TBS this summer, to-date.
- NFL Network’s live preseason football game action for Aug. 18-20 (six game telecasts) averaged 1.49 million viewers, up 42 percent from last year (Aug. 18-20, 2016: average of 1.046 million viewers for six games), with the obvious caveat that the 2016 games took place opposite the Summer Olympics. It was also up slightly from the 1.489 million viewer average of the five preseason games two years ago (Aug. 21-23, 2015).
- MLB Network’s live baseball game action (not counting look-in coverage during “MLB Tonight”) for Aug. 14-19 averaged 221,000 viewers and 57,000 adults 18-49 from the thirteen game showcase telecasts, up 23 percent (in viewers) and up 18 percent (in adults 18-49) from the year-ago week (Aug. 15-20, 2016: average of 180,000 viewers/59,000 adults 18-49 from eleven telecasts); also, up 3 percent (in viewers) and down 16 percent (in adults 18-49) from two years ago (Aug. 19-23, 2015: average of 214,000 viewers/68,000 adults 18-49 from eight telecasts).
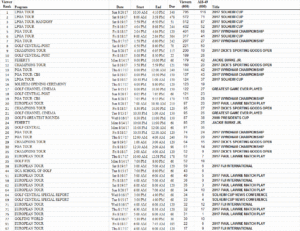
- Golf Channel’s tournaments coverage from Aug. 17-20:
- LPGA Tour: Solheim Cup (Aug. 18-20): 545,000 viewers (+141 percent from Sep. 18-20, 2015: 226,000 viewers)
- PGA Tour: Wyndham Championship (Aug. 17-18; Golf Channel only): 331,000 viewers (+60 percent from Aug. 18-19 & 21, 2016: 207,000 viewers)
- Champions Tour: Dick’s Sporting Goods Open (Aug. 18-30): 151,000 viewers (-32 percent from July 8-10, 2016: 222,000 viewers)
- European Tour: Paul Lawrie Match Play (Aug. 17-20): 51,000 viewers (-29 percent from Aug. 4-7, 2016: 71,000 viewers)
- European Tour: Fiji International (Aug. 17-20): 33,000 viewers (-26 percent from Oct. 6-9, 2016: 45,000 viewers)
- The U.S. Open Cup semifinal soccer match between United Soccer League’s FC Cincinnati and Major League Soccer’s New York Red Bulls (which the Red Bulls had won in overtime 3-2) posted strong ratings in the Cincinnati TV market. There, the Channel 64 (CW) telecast drew a 6.0 local rating, peaking at a 7.4 rating and 64,100 local households at 9:45 p.m., as the regulation time was nearing its end with a 2-2 score. FC Cincinnati’s appearance in the semifinals marked the deepest advancement in the U.S. Open Cup for a non-MLS squad (FC Cincinnati competes in the second-tier United Soccer League) since 2011. (Source: Cincinnati Business Courier)
MLB Network Top 25 (and Select) Programs
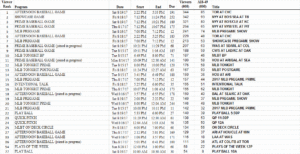
Click on image grid for larger view
In total viewership for its entire week in Prime Time (8 p.m. to 11 p.m.), MLB Network is up +2 percent (213,000 vs. 208,000) from one week earlier and up +37 percent (213,000 vs. 155,000) from the same week one year ago (August 15-21, 2016).
In total viewership for its entire week in Total Day (6 a.m. to 5:59 a.m.), MLB Network is up +9 percent (108,000 vs. 99,000) from one week earlier and up +15 percent (108,000 vs. 104,000) from the same week one year ago (August 15-21, 2016).
Viewership averages for the following MLB Network programs of the week:
- “MLB Central” (Aug. 14-18 10 a.m.): 59,000 (23,000 adults 18-49)
- “High Heat” (Aug. 14-18): 45,000 (11,000 adults 18-49)
- “Rundown” (Aug. 14-15): 61,000 (16,000 adults 18-49)
- “MLB Now” (Aug. 14): 64,000 (34,000 adults 18-49)
- “Intentional Talk” (Aug. 14 & 18): 116,000 (39,000 adults 18-49)
- “MLB Tonight BP” (Aug. 14-17 & 19): 132,000 (43,000 adults 18-49)
- “MLB Tonight” (Aug. 14-18 prime time): 148,000 (54,000 adults 18-49)
- “Quick Pitch” (Aug. 14-20 late night): 111,000 (46,000 adults 18-49)
Major League Baseball: New York Yankees @ Boston Red Sox (TBS, Aug. 20 1:00-5:26 p.m.): 609,000 viewers (219,000 adults 18-49)
NFL Network Top 25 (and Select) Programs
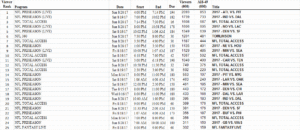
Click on image grid for larger view
In total viewership for its entire week in Prime Time (8 p.m. to 11 p.m.), NFL Network is down -37 percent (803,000 vs. 1,280,000) from one week earlier and up +8 percent (803,000 vs. 746,000) from the same week one year ago (August 15-21, 2016).
In total viewership for its entire week in Total Day (6 a.m. to 5:59 a.m.), NFL Network is down -13 percent (385,000 vs. 440,000) from one week earlier and up +17 percent (385,000 vs. 329,000) from the same week one year ago (August 15-21, 2016).
Viewership averages for the following daily NFL Network programs of the week:
- “Good Morning Football” (Aug. 14-18 7 a.m.): 100,000 (56,000 adults 18-49)
- “NFL Total Access” (Aug. 14-18 7 p.m.): 276,000 (135,000 adults 18-49)
- “NFL Total Access” (Aug. 14-17 11 p.m.): 233,000 (123,000 adults 18-49)
Golf Channel Top 25 (and Select) Programs
Click on image grid for larger view
In total viewership for its entire week in Prime Time (8 p.m. to 11 p.m.), Golf Channel is down -6 percent (116,000 vs. 123,000) from one week earlier and up +81 percent (116,000 vs. 64,000) from the same week one year ago (August 15-21, 2016).
In total viewership for its entire week in Total Day (6 a.m. to 5:59 a.m.), Golf Channel is up +58 percent (142,000 vs. 90,000) from one week earlier and up +21 percent (142,000 vs. 117,000) from the same week one year ago (August 15-21, 2016).
Viewership averages for the following daily Golf Channel programs of the week:
- “The Morning Drive” (Aug. 14-18 8 a.m.): 37,000 (14,000 adults 18-49)
- “The Morning Drive” (Aug. 14-17 9 a.m.): 45,000 (13,000 adults 18-49)
- “The Morning Drive” (Aug. 14-16 9 a.m.): 43,000 (11,000 adults 18-49)
- “Golf Central” (Aug. 14-16 6 p.m.): 29,000 (8,000 adults 18-49)
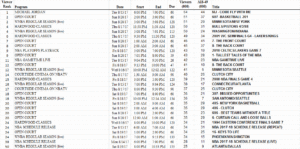
NBA TV Top 25 (and Select) Programs
Click on image grid for larger view
In total viewership for its entire week in Prime Time (8 p.m. to 11 p.m.), NBA TV is down -28 percent (31,000 vs. 43,000) from one week earlier and even (31,000 vs. 31,000) from the same week one year ago (August 15-21, 2016).
In total viewership for its entire week in Total Day (6 a.m. to 5:59 a.m.), NBA TV is down -17 percent (24,000 vs. 29,000) from one week earlier and up +14 percent (24,000 vs. 21,000) from the same week one year ago (August 15-21, 2016).
Tennis Channel
In total viewership for its entire week in Prime Time (8 p.m. to 11 p.m.), Tennis Channel is down -1 percent (79,000 vs. 80,000) from one week earlier.
In total viewership for its entire week in Total Day (6 a.m. to 5:59 a.m.), Tennis Channel is up +10 percent (45,000 vs. 41,000) from one week earlier.
__________________________________________________
WWE Raw
Monday, August 14, 2017 on USA Network
8-11:12 p.m.: 3.223 million total viewers and 1.453 million adults 18-49
-1% from 3.240 million total viewers and +8% from 1.348 million adults 18-49 on 8/07/17
+11% from 2.910 million total viewers and +14% from 1.276 million adults 18-49 on 8/15/16
8-9 p.m.: 1.97 household rating, 3.424 million total viewers and 1.552 million adults 18-49
+5% from 3.248 million total viewers and +15% from 1.352 million adults 18-49 on 8/07/17
+19% from 2.879 million total viewers and +21% from 1.286 million adults 18-49 on 8/15/16
9-10 p.m.: 1.88 household rating, 3.298 million total viewers and 1.476 million adults 18-49
-1% from 3.319 million total viewers and +8% from 1.367 million adults 18-49 on 8/07/17
+7% from 3.083 million total viewers and +8% from 1.364 million adults 18-49 on 8/15/16
10-11:12 p.m.: 1.78 household rating, 2.993 million total viewers and 1.351 million adults 18-49
-5% from 3.149 million total viewers and +2% from 1.328 million adults 18-49 on 8/07/17
+8% from 2.784 million total viewers and +14% from 1.189 million adults 18-49 on 8/15/16
Reruns on NBC Universo
Fri. Aug. 18 8-11 p.m.: 54,000 total viewers (25,000 adults 18-49)
Late Fri. Aug. 18/Early Sat. Aug. 19 12-3 a.m.: 23,000 total viewers (13,000 adults 18-49)
WWE SmackDown
Tuesday, August 15, 2017 on USA
8-10 p.m.: 1.46 household rating, 2.534 million total viewers and 0.994 million adults 18-49
-2% from 2.588 million total viewers and -3% from 1.025 million adults 18-49 on USA 8/08/17
+3% from 2.471 million total viewers and -5% from 1.043 million adults 18-49 on USA 8/16/16
Reruns on NBC Universo
Sat. Aug. 19 10 p.m.-12 a.m.: 35,000 total viewers (9,000 adults 18-49)
Late Sat. Aug. 19/Early Sun. Aug. 20 2-4 a.m.: 19,000 total viewers (14,000 adults 18-49)


