If you would like to ask about or request ratings for a program or event on these networks, please reach Douglas on Twitter @SonOfTheBronx.
Ratings News and Notes
-
Boston Red Sox’s ten-inning 3-2 victory over their longtime rival New York Yankees in Bronx, NY on Sunday, Aug. 13 posted 2.563 million viewers on ESPN which is the best audience figure for a “Sunday Night Baseball” telecast since the very first MLB game played in the 2017 regular season, Chicago Cubs at St. Louis Cardinals from Apr. 2 (3.615 million viewers). Even prior to Aug. 13, “SNB” was experiencing double-digit increases from last year. “SNB” is averaging 1.86 million viewers this season, thru Aug. 13
-
The first week of the “Little League World Series” on ESPN and ESPN2 from Aug. 7-12 averaged 602,000 viewers, down 7 percent from two years ago, the most recent LLWS first week that did not air opposite the Olympics. (Aug. 11-16, 2015 on ESPN, ESPN2 and ESPNU: average of 647,000 viewers)
-
Coverage of tennis’ “Rogers Cup” from Canada on ESPN2 saw mixed results for both this year’s men’s and women’s tournaments.
The men’s side from Montreal on Aug. 10-13 averaged 183,000 viewers, a 20-percent increase from last year (July 28-31, 2016: average of 153,000 viewers) — although, a 29_percent decrease from two years ago (Aug. 13-16, 2015: average of 259,000 viewers). The men’s final on Aug. 13 (312,000 viewers), featuring Alexander Zverev’s victory over Roger Federer, was up 53 percent from last year’s final (Novak Djokovic-Kei Nishikori on July 31, 2016: 204,000 viewers) but down 29 percent from two years ago (Andy Murray-Novak Djokovic on Aug. 10, 2015: 442,000 viewers).
The women’s side from Toronto on Aug. 12-13 averaged 192,000 viewers, down 11 percent from last year (July 30-31, 2016: average of 216,000 viewers) and down 46 percent from two years ago (Aug. 15-16, 2015: average of 359,000 viewers). The women’s final on Aug. 13 (187,000 viewers), featuring Elina Svitolina’s victory over Caroline Wozniacki, was down 25 percent from last year’s final (Simona Halep-Madison Keys on July 31, 2016: 251,000 viewers) and down 54 percent from two years ago (Belinda Bencic-Simona Halep on Aug. 10, 2015: 410,000 viewers).
ESPN Top 25 (and Select) Programs
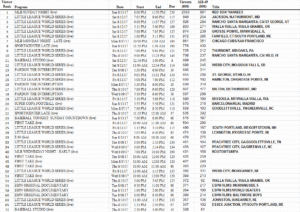
Click on image grid for larger view
In total viewership for its entire week in Prime Time (8 p.m. to 11 p.m.), ESPN is up +38 percent (895,000 vs. 650,000) from one week earlier and down -11 percent (895,00 vs. 1,008,000) from the same week one year ago (August 8-14, 2016).
In total viewership for its entire week in Total Day (6 a.m. to 5:59 a.m.), ESPN is up +27 percent (468,000 vs. 368,000) from one week earlier and up +12 percent (468,000 vs. 417,000) from the same week one year ago (August 8-14, 2016).
ESPN’s daily programs viewership averages for the week:
- “First Take” (ESPN, Aug. 7-11 10 a.m.): 415,000 (242,000 adults 18-49)
- “Outside the Lines: First Report” (ESPN, Aug. 7-9): 254,000 (151,000 adults 18-49)
- “NFL Live” (ESPN, Aug. 7-9): 310,000 (179,000 adults 18-49)
- “NBA: The Jump” (ESPN, Aug. 7): 299,000 (160,000 adults 18-49)
- “SportsNation” (ESPN, Aug. 7): 280,000 (169,000 adults 18-49)
- “Highly Questionable” (ESPN, Aug. 7): 389,000 (253,000 adults 18-49)
- “Around the Horn” (ESPN, Aug. 7-9): 460,000 (216,000 adults 18-49)
- “Pardon the Interruption” (ESPN, Aug. 7-9): 631,000 (306,000 adults 18-49)
- “SportsCenter” (ESPN, Aug. 7-11 7 a.m.): 256,000 (151,000 adults 18-49)
- “SportsCenter” (ESPN, Aug. 7-11 8 a.m.): 263,000 (160,000 adults 18-49)
- “SportsCenter” (ESPN, Aug. 7-11 9 a.m.): 328,000 (192,000 adults 18-49)
- “SportsCenter” (ESPN, Aug. 7-10 6 p.m.): 370,000 (190,000 adults 18-49)
- “SportsCenter” (ESPN, Aug. 8-11 11 p.m.): 438,000 (250,000 adults 18-49)
- “SportsCenter” (ESPN, Aug. 7-11 midnight): 410,000 (230,000 adults 18-49)
- “SportsCenter at Night” (ESPN, Aug. 8-11 1 a.m.): 358,000 (223,000 adults 18-49)
ESPN2 Top 25 (and Select) Programs
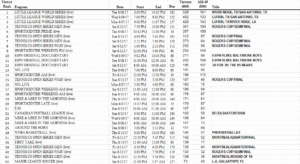
Click on image grid for larger view
In total viewership for its entire week in Prime Time (8 p.m. to 11 p.m.), ESPN2 is up +59 percent (266,000 vs. 167,000) from one week earlier and up +56 percent (266,000 vs. 170,000) from the same week one year ago (August 8-14, 2016).
In total viewership for its entire week in Total Day (6 a.m. to 5:59 a.m.), ESPN2 is up +8 percent (135,000 vs. 125,000) from one week earlier and down -13 percent (135,000 vs. 156,000) from the same week one year ago (August 8-14, 2016).
ESPN2’s daily show viewership averages for the week:
- “Mike & Mike in the Morning” (ESPN2, Aug. 7-11): 151,000 (72,000 adults 18-49)
- “Jalen & Jacoby” (ESPN2, Aug. 7-9 afternoon): 104,000 (63,000 adults 18-49)
- “MLB Network’s Intentional Talk” (ESPN2, Aug. 7-9): 74,000 (35,000 adults 18-49)
- “College Football Live” (ESPN2, Aug. 7-11 5 p.m.): 93,000 (42,000 adults 18-49)
- “Best of Mike & Mike in the Morning” (ESPN2, Late Aug. 7-8 5 a.m.): 30,000 (14,000 adults 18-49)
- “First Take” (ESPN2, Aug. 10): 136,000 (77,000 adults 18-49)
- “NBA: The Jump” (ESPN2, Aug. 8-9): 118,000 (64,000 adults 18-49)
- “SportsNation” (ESPN2, Aug. 8-9): 145,000 (79,000 adults 18-49)
- “Around the Horn” (ESPN2, Aug. 7-8): 135,000 (68,000 adults 18-49)
- “SportsCenter” (ESPN2, Aug. 7-11 10 a.m.): 109,000 (54,000 adults 18-49)
- “SportsCenter” (ESPN2, Aug. 7-9 11 a.m.): 100,000 (53,000 adults 18-49)
- “SportsCenter” (ESPN2, Aug. 10-11 6 p.m.): 134,000 (68,000 adults 18-49)
- “SportsCenter” (ESPN2, Aug. 8 & 10 prime time): 165,000 (85,000 adults 18-49)
- “SportsCenter” (ESPN2, Aug. 7 11 p.m.): 170,000 (87,000 adults 18-49)
- “SportsCenter” (ESPN2, Aug. 7 midnight): 124,000 (73,000 adults 18-49)
ESPNU Top 25 (and Select) Programs
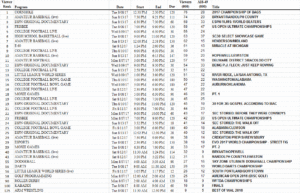
Click on image grid for larger view
In total viewership for its entire week in Prime Time (8 p.m. to 11 p.m.), ESPNU is down -45 percent (38,000 vs. 69,000) from one week earlier and up +46 percent (38,000 vs. 26,000) from the same week one year ago (August 8-14, 2016).
In total viewership for its entire week in Total Day (6 a.m. to 5:59 a.m.), ESPNU is down -36 percent (29,000 vs. 45,000) from one week earlier and up +38 percent (29,000 vs. 21,000) from the same week one year ago (August 8-14, 2016).
ESPNU’s daily show viewership averages for the week:
- “Dan Le Batard Show” (ESPNU, Aug. 7-11): 20,000 (11,000 adults 18-49)
Source: Live+Same Day data, Nielsen Media Research


